In this article
February 11, 2026
-
11 min read
Ecommerce Returns: Rates, Costs, and How AI Reduces Them


The state of ecommerce and why returns matter
Ecommerce keeps expanding. Global online sales surpassed 6 trillion dollars and continue to climb, now representing roughly one in five retail dollars. That growth brings new categories, cross-border buyers, and more first-time customers. Social and marketplace-driven discovery, faster delivery promises, and BNPL all increase trial purchases, which improves conversion but also raises the odds of returns.
Returns have grown even faster than sales, and they quietly shape profit, cash flow, and customer trust. Each return often costs 10 to 20 dollars to process before resale discounting, and volumes spike during holidays and in high-fit categories like apparel. Cross-border returns add friction with duties, longer transit, and lower recovery value. Net effect: without a plan, returns can erase several points of margin and slow inventory turns.
Why it matters: Operators who measure return rate by SKU and reason can prevent avoidable returns while keeping customers happy. Start simple, prove impact on a few high-velocity SKUs, then scale the playbook across the catalog. Leading teams focus on the first mile to reduce the need for the last mile of reverse logistics:
- Baseline return rate and top reason codes by SKU, channel, and cohort
- Tighten PDP expectations with specifics, video, and clear fit guidance
- Nudge exchanges over refunds and highlight checkout-funded return coverage
- Upgrade packaging on damage-prone items and monitor results weekly
Big picture: Return rate is the percent of orders sent back. Across ecommerce it hovers around the high teens, and it can spike much higher in apparel and during holidays.
What you’ll learn: This guide breaks down the financial impact of returns, the common causes, and the strategies that reduce them. We will also show how AI and automation, including Redo, help operators lower return risk without hurting customer experience. See how Redo’s checkout add-on can make returns free for customers while costing the merchant nothing.
The Financial Impact of Returns
Returns are not just a service cost. They flow through your P&L, hit working capital, and erode contribution margin if unmanaged. The good news: most brands can cut avoidable returns by 10 to 30 percent with focused effort.
The first step is sizing the problem with real numbers, not anecdotes. Then model how process changes move margin.
What the numbers say: Online return rates often sit between 15 and 20 percent. Apparel can exceed 30 percent, especially in peak season. Processing a return frequently costs 10 to 20 dollars when you add reverse shipping, inspection, repackaging, and resale discounting. Unless you shift reverse logistics to checkout-funded coverage, which brings merchant out-of-pocket for shipping and handling to $0 on covered orders (see pricing). Salvage value and resale discounting still apply.
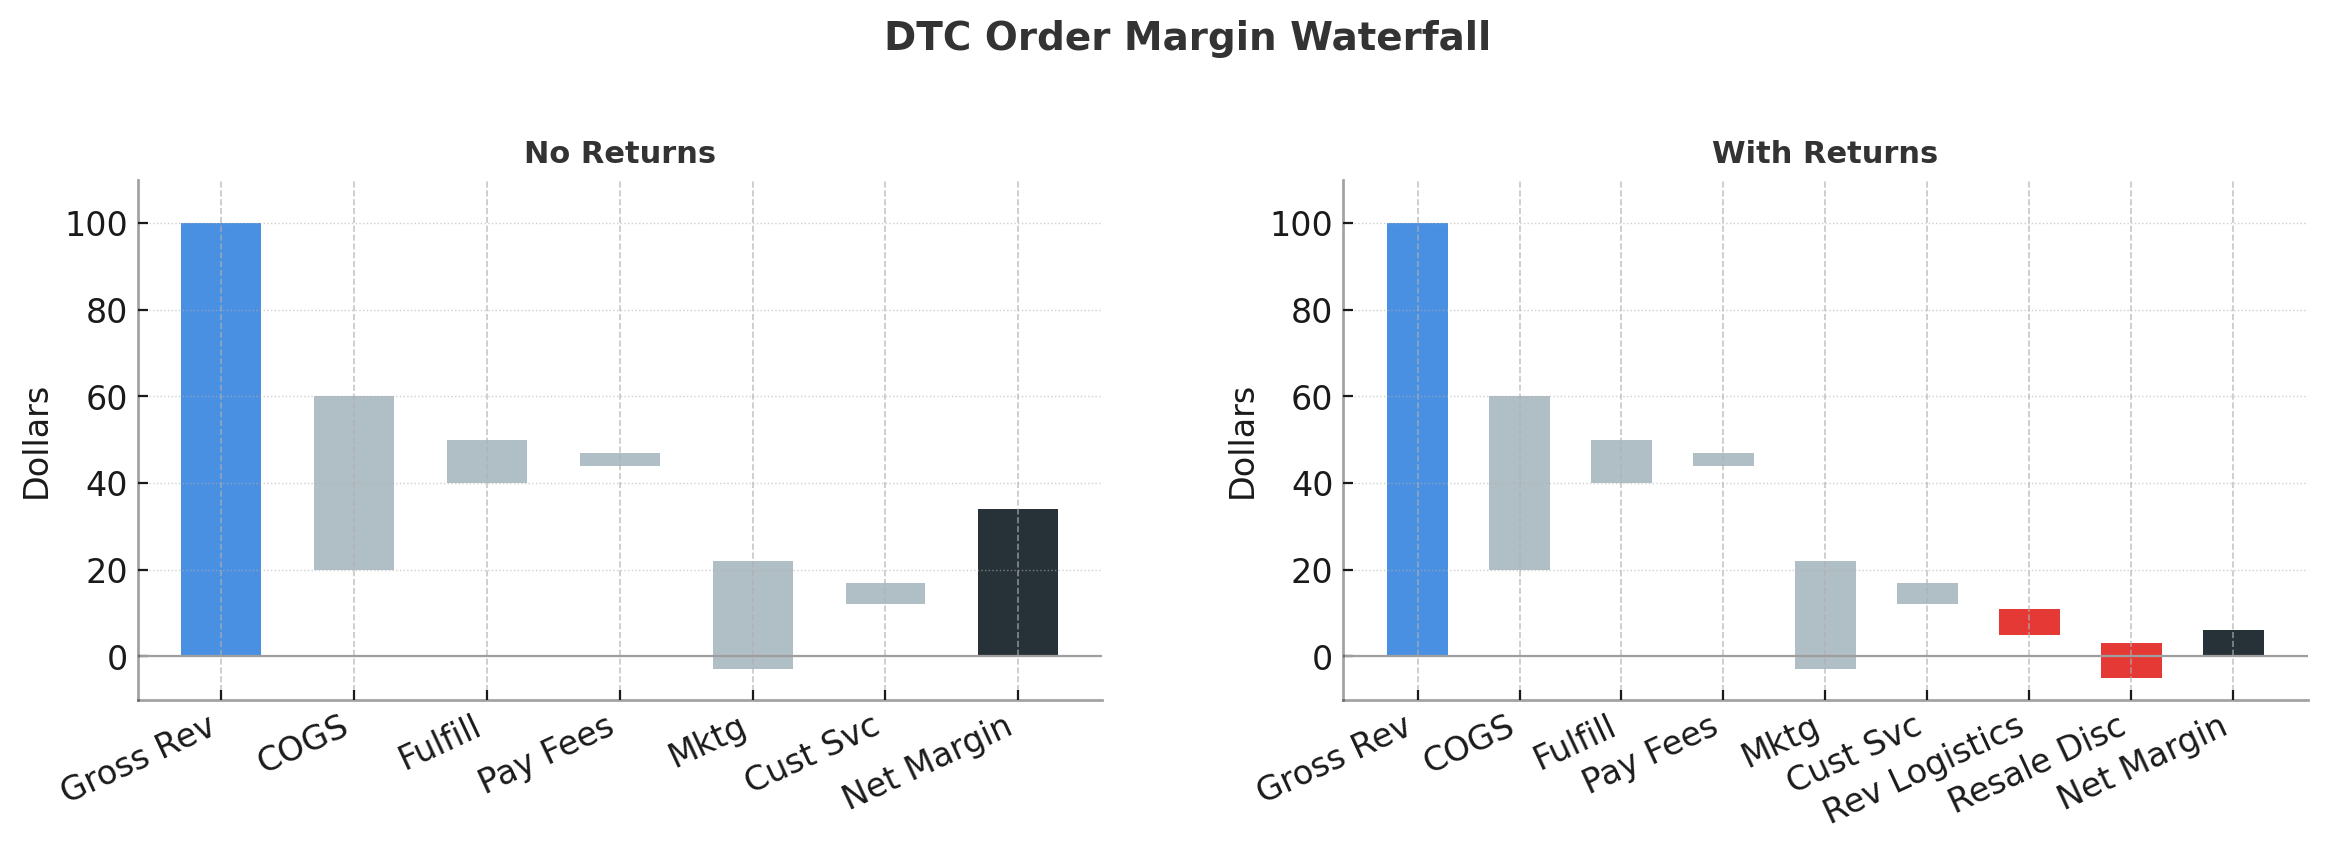
How returns drain profit: Imagine a 100 dollar order with 60 dollars cost of goods and 12 dollars outbound fulfillment. You record 28 dollars gross margin. If 18 percent of orders return and each return costs 14 dollars to process, you lose the 28 dollars margin on those units, plus 14 dollars more. If those returns are covered via Redo, the 14 dollars reverse logistics cost comes off your books and your loss is limited to the original margin and any resale discounting. This lifts your blended margin relative to unmanaged returns.
Real brand examples: A fashion marketplace saw a 32 percent return rate tied to inconsistent size charts across sellers. After consolidating size guidance and adding fit recommendations, returns fell to 24 percent and repeat purchase rose 9 percent within a quarter. A consumer electronics brand had a 12 percent return rate driven by in-transit damage. By right-sizing boxes and upgrading dunnage, damage-related returns dropped by 40 percent, saving about 1.80 dollars per order.
Common Reasons for Product Returns
Most returns concentrate in a few causes. A simple Pareto analysis often shows that three or four reasons drive more than half of returns. Fixing those first moves the needle fastest.
Diagnose with structured return reasons, photos, and notes from customers and agents. Then link each reason to actions you can take pre-purchase and post-purchase.
Misleading product descriptions: Vague or marketing-heavy copy sets the wrong expectation. Replace adjectives with specifics: materials, dimensions, weight, care instructions, included accessories, and what is not included. Short product videos and 360 images reduce “not as described” returns by making texture and scale tangible.
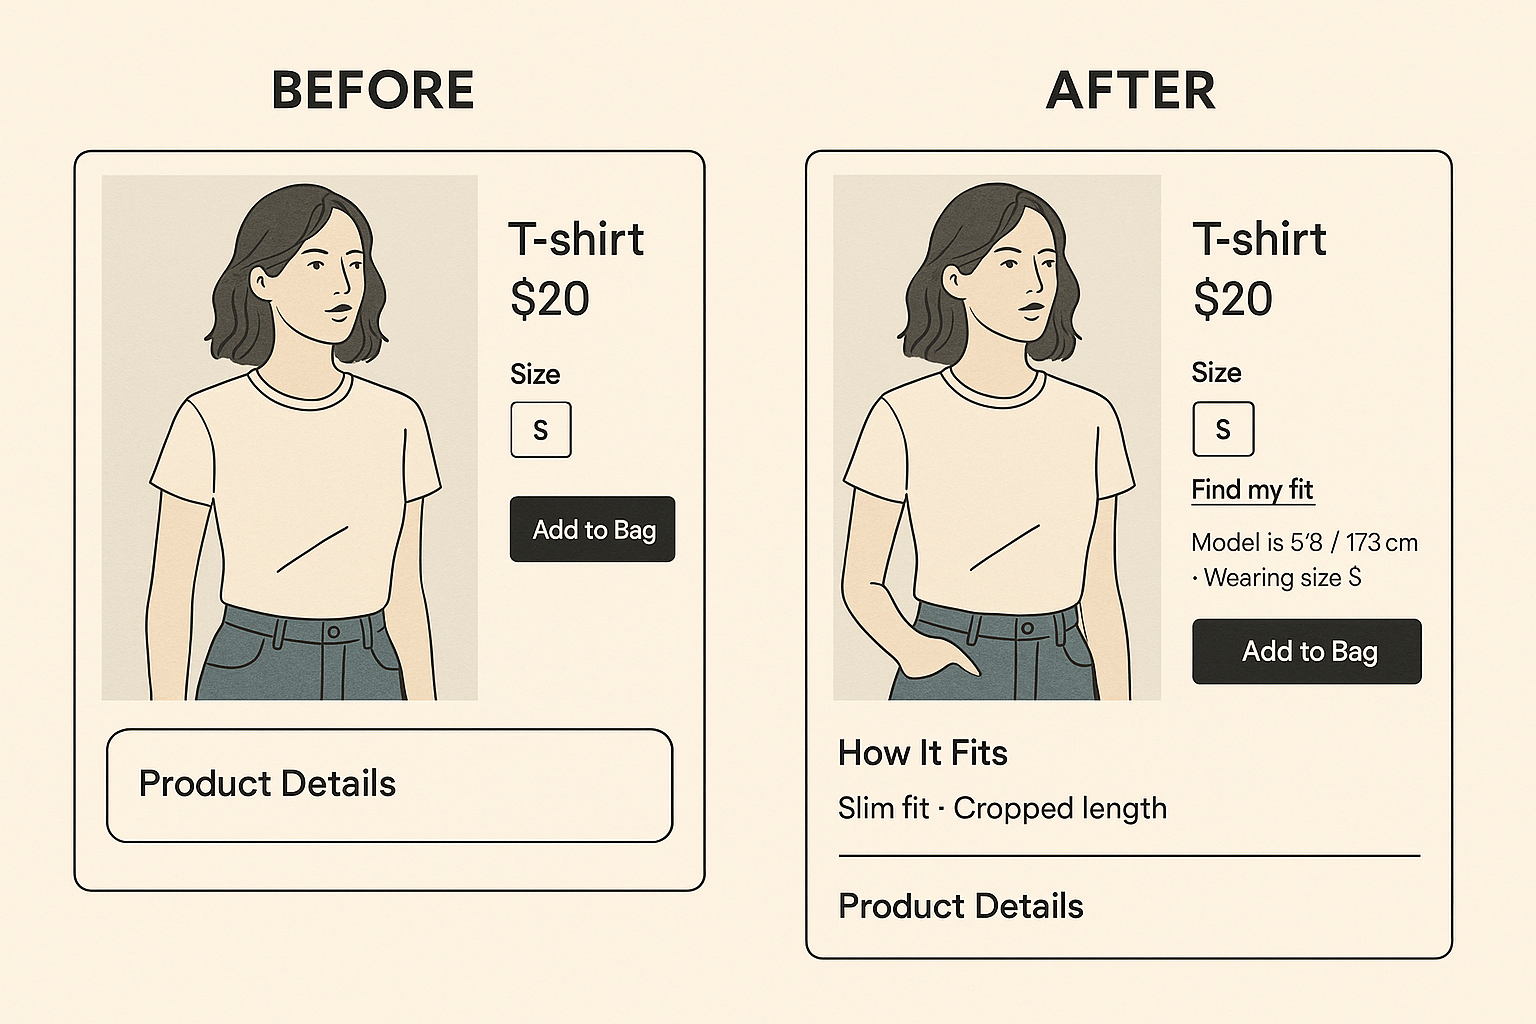
Sizing and fit issues: Fit is the top driver in apparel and footwear. Standardize size charts by brand and region, add garment measurements, and show model stats. Fit finders that use prior purchases reduce size-related returns by 5 to 15 percent when they default to a recommended size.
Quality and damage during shipping: A small increase in packaging protection can prevent outsized losses. Validate packaging with drop tests, add corner protection, and right-size boxes to limit movement. Flag repeat-damage SKUs and adjust packaging by item, not just by order value.
Customer dissatisfaction: Sometimes the product is fine, but the customer’s use case is different. Pre-purchase Q&A, clearer compatibility notes, and expectation-setting on performance and maintenance lower regret-driven returns.

Strategies to Minimize Returns
Reducing returns is not one tactic; it is a playbook that aligns merchandising, PDP design, fulfillment, and support. The aim is simple: help customers choose the right product, deliver it in good shape, and make it easy to exchange instead of refund.
Start with high-velocity SKUs and repeat offenders. Fixing the top 20 percent of problem SKUs can cut total returns dramatically.
Improving product descriptions and images: Pair concise copy with specifics. Include a “What to expect” section that spells out feel, fit, assembly, and limitations. Add 360s, close-ups of zippers or seams, and a 15 to 30 second video. Brands that add size and scale context, like an item next to a common object, see fewer “smaller than expected” returns.
Implementing size guides and fit tools: Use brand-specific charts, garment measurements, and body-shape guidance. Fit tools that leverage a customer’s past purchases or a few body inputs can reduce exchanges while lifting conversion. Place the recommendation above the size selector so it drives the choice.
Enhancing packaging and shipping processes: Right-size containers to cut damage. Use edge crush–tested cartons for heavy items and add corner posts where needed. For fragile goods, standardize “fragile” carrier handling codes and include a simple, illustrated unboxing guide to prevent accidental damage on arrival.
Offering virtual try-on or augmented reality options: AR previews for furniture, decor, and eyewear align expectations with reality. Even a basic “see it in your room” placement can lower “not as expected” returns without depressing conversion.
Balancing Returns and Customer Satisfaction
A strict policy can lower return volume but hurt lifetime value. A flexible, fair policy builds trust and nudges exchanges over refunds, protecting revenue while keeping customers happy.
Set the tone with clarity. Customers forgive friction when they understand the rules and timelines up front.
Importance of a flexible return policy: Offer at least 30 days for standard goods, longer for gifts and holidays. Allow self-serve exchanges that preserve promo pricing and free shipping. Offer free returns to shoppers who opt into checkout return coverage like Redo, so you maintain generosity without adding merchant cost.
Building trust through transparent communication: State eligibility, condition standards, and restocking fees in plain language on PDPs and in order confirmation emails. Provide real-time status on return shipments and refunds. Uncertainty, not policy length, drives support tickets.
Customer feedback loops for continuous improvement: Collect structured reason codes, photos, and short free-text notes in your returns portal. Route themes to merchandising and operations every week. Close the loop by updating PDPs and packaging, and call out the changes on-site to show you listened.
Example policy clarity: “Free exchanges within 30 days. Returns for refund within 30 days, unworn and with tags. Instant exchange credit issued upon label scan. If you added Return Coverage at checkout, your return shipping is free.”
Leveraging Technology to Reduce Returns
Data and AI can predict, prevent, and reroute returns before they happen. The best programs combine pre-purchase guidance with smart post-purchase workflows.
You do not need a data science team to start. Aim for simple models and rules, then layer sophistication as you gather signal.
Role of AI and data analytics in predicting returns: Build SKU-level return risk scores using reason codes, reviews, and fit-related attributes. Surface proactive prompts, like “customers your size kept size M 84 percent of the time,” or “this runs narrow.” Use risk scores to highlight return coverage at checkout and to show exchange-first options on high-risk items. Redo powers AI agents that learn from your return data to tailor sizing and expectation prompts.
Utilizing chatbots for customer inquiries: AI chat can answer pre-purchase questions about fit, materials, compatibility, and delivery timelines at any hour. That reduces “didn’t fit” and “arrived too late” returns. Brands using AI agents to guide sizing and care see both higher conversion and fewer returns, because shoppers choose better.
Implementing return management software: A modern returns platform centralizes policies, automates labels, and steers outcomes toward exchanges and store credit. Use dynamic flows: block returns on final sale items, offer instant credit for VIPs, and route high-risk items to inspection. Redo’s returns and warranty platform adds exchange incentives, defect photo capture, and carrier routing rules that cost the business $0 on covered orders.
Measuring Success and Adjusting Strategies
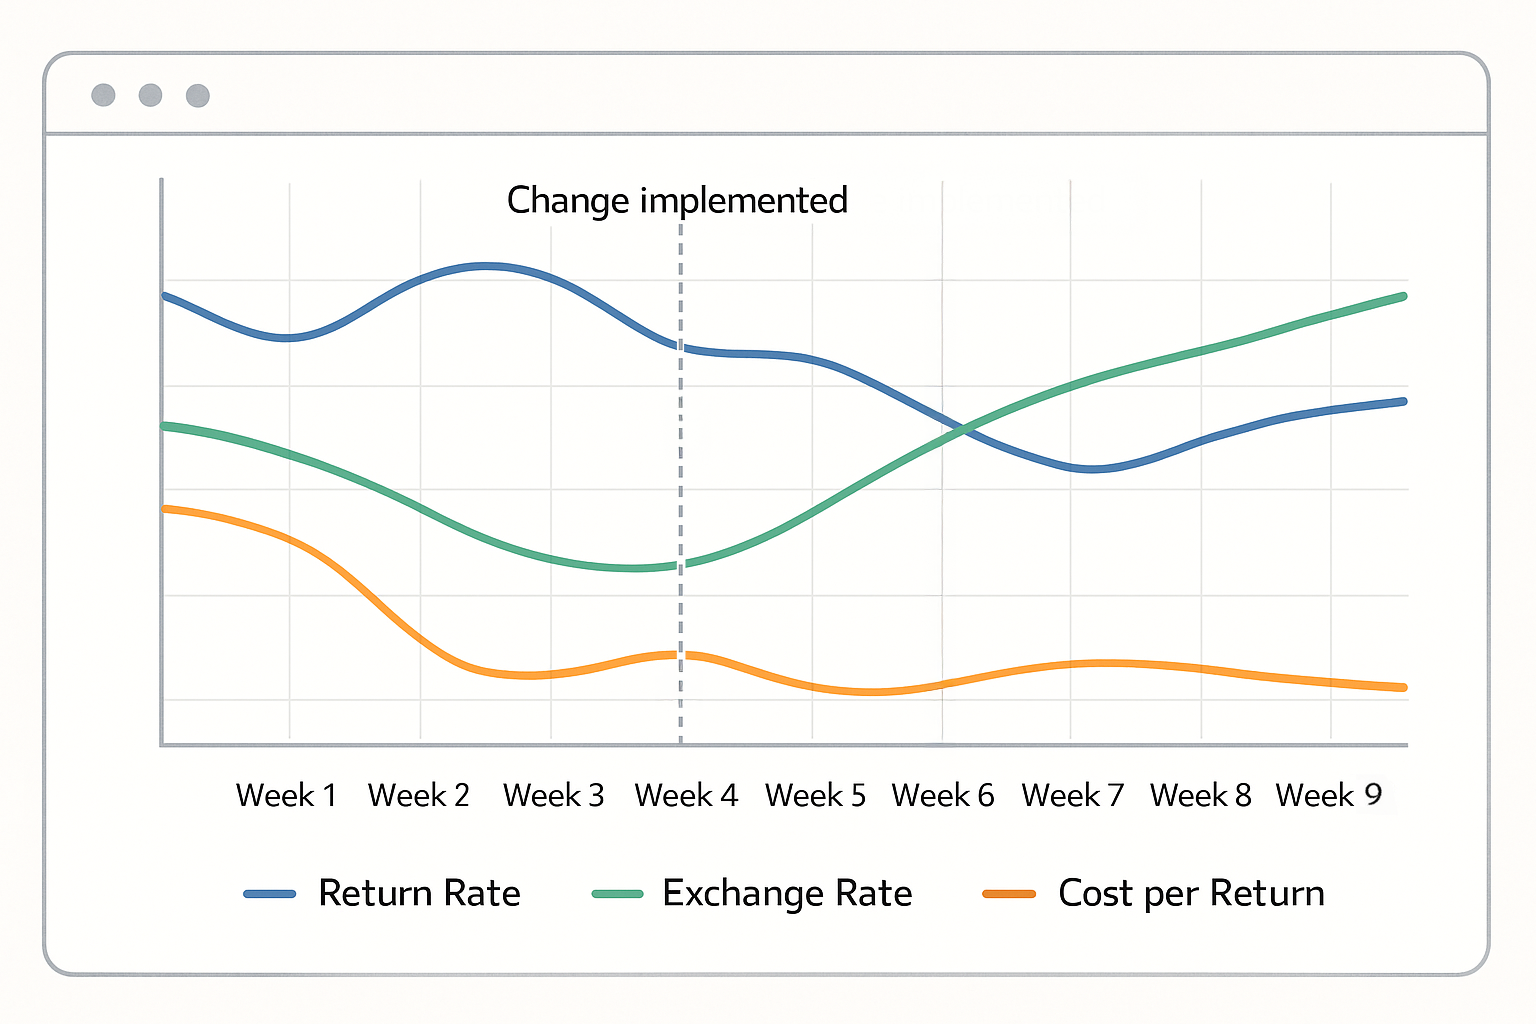
If you cannot measure it, you cannot improve it. Set a clear baseline, then track a small set of KPIs weekly and monthly.
Focus on trends by category and SKU. Celebrate improvements, and reinvest savings into better content and packaging.
KPIWhat it meansHealthy range or targetReturn rate (by order and by item)Percent of items or orders returnedOverall 10–20 percent; apparel often higher but aim to trend down by SKUSize/fit return rateShare of returns due to fitReduce by 20–30 percent after adding fit toolsDamage-related return rateShare due to in-transit damageUnder 1 percent for most goods; under 3 percent for fragileExchange ratePercent of returns converted to exchanges25–50 percent with exchange-first flowsCost per returnAll-in reverse logistics cost per unit10–20 dollars without coverage; $0 merchant out-of-pocket on orders covered by Redo’s checkout add-onRefund cycle timeDays from drop-off to refundUnder 5 days; instant credit optional for VIPsKeep rateRevenue kept after returnsTrack by cohort and campaign; should lift as return rate fallsCSAT/NPS for returnsSatisfaction with the return experienceAim for parity with purchase CSAT
Analyzing return data for actionable insights: Segment by SKU, category, acquisition channel, and customer cohort. Look for reasons that over-index on a handful of items, then fix those PDPs or packaging. Monitor lifetime value of customers who return early, and create save plays (fit help, alternate product) before they churn.
Continuous testing and optimization of return policies: A/B test policy variables like exchange incentives, instant credit, and extended windows for VIPs. Test PDP modules that set expectations. In operations, pilot packaging upgrades on the top five damage-prone SKUs before rolling out broadly. Document wins and make them standard.
Putting it into motion
Returns are a lever on profitability. Cutting avoidable returns reduces waste in reverse logistics, protects margin, and creates happier customers who keep what they buy.
Balance is key. Protect customer goodwill with flexible, clear policies, while using data and AI to guide better choices and streamline exchanges over refunds.
Recap: Returns typically sit in the high teens and can erase margin without a plan. Most of the problem lives in a few fixable causes: fit, expectations, and damage.
What to do next: Audit your top 50 SKUs for return reasons. Upgrade PDPs and fit guidance, fix packaging on damage-prone items, and reframe your returns flow to favor exchanges. If you want a faster start, Redo can benchmark your return data, deploy AI guidance, automate exchange-first flows that lift keep rate, and offer free returns funded at checkout so return shipping costs your business $0 on covered orders.
Key Insight
Reduce returns where they start: fit, expectations, and packaging. Then use AI-guided shopping, checkout-funded free returns, and exchange-first flows to protect margin without sacrificing customer trust.
About Redo
Redo helps ecommerce brands turn post-purchase moments into lasting relationships.
Use AI-powered return flows, exchange-first logic, instant credit, and analytics to understand not just what customers bought, but why they come back.