In this article
May 13, 2026
-
10 min read
Why Exchange Rate Is the Most Underrated Retention Metric


Every ecommerce operator has a dashboard. Most of those dashboards measure conversion rate, average order value, customer lifetime value, repeat purchase rate, churn, and maybe NPS. They almost never measure exchange rate. The brands that do measure it consistently discover the same thing: it is one of the highest-leverage metrics in their entire post-purchase operation, and ignoring it has cost them years of compounding retention upside.
This is the case for treating exchange rate as a retention metric on equal footing with the others your team already watches. Not a customer service operations number. Not a returns ops KPI buried in a quarterly review. A retention metric that connects directly to lifetime value and that you can move with specific operational interventions.
What Exchange Rate Actually Measures
Exchange rate is the percentage of returns that resolve as exchanges rather than refunds, calculated as exchanges divided by total returns over a given period. If you process 200 returns in a month and 60 of them become exchanges, your exchange rate is 30 percent.
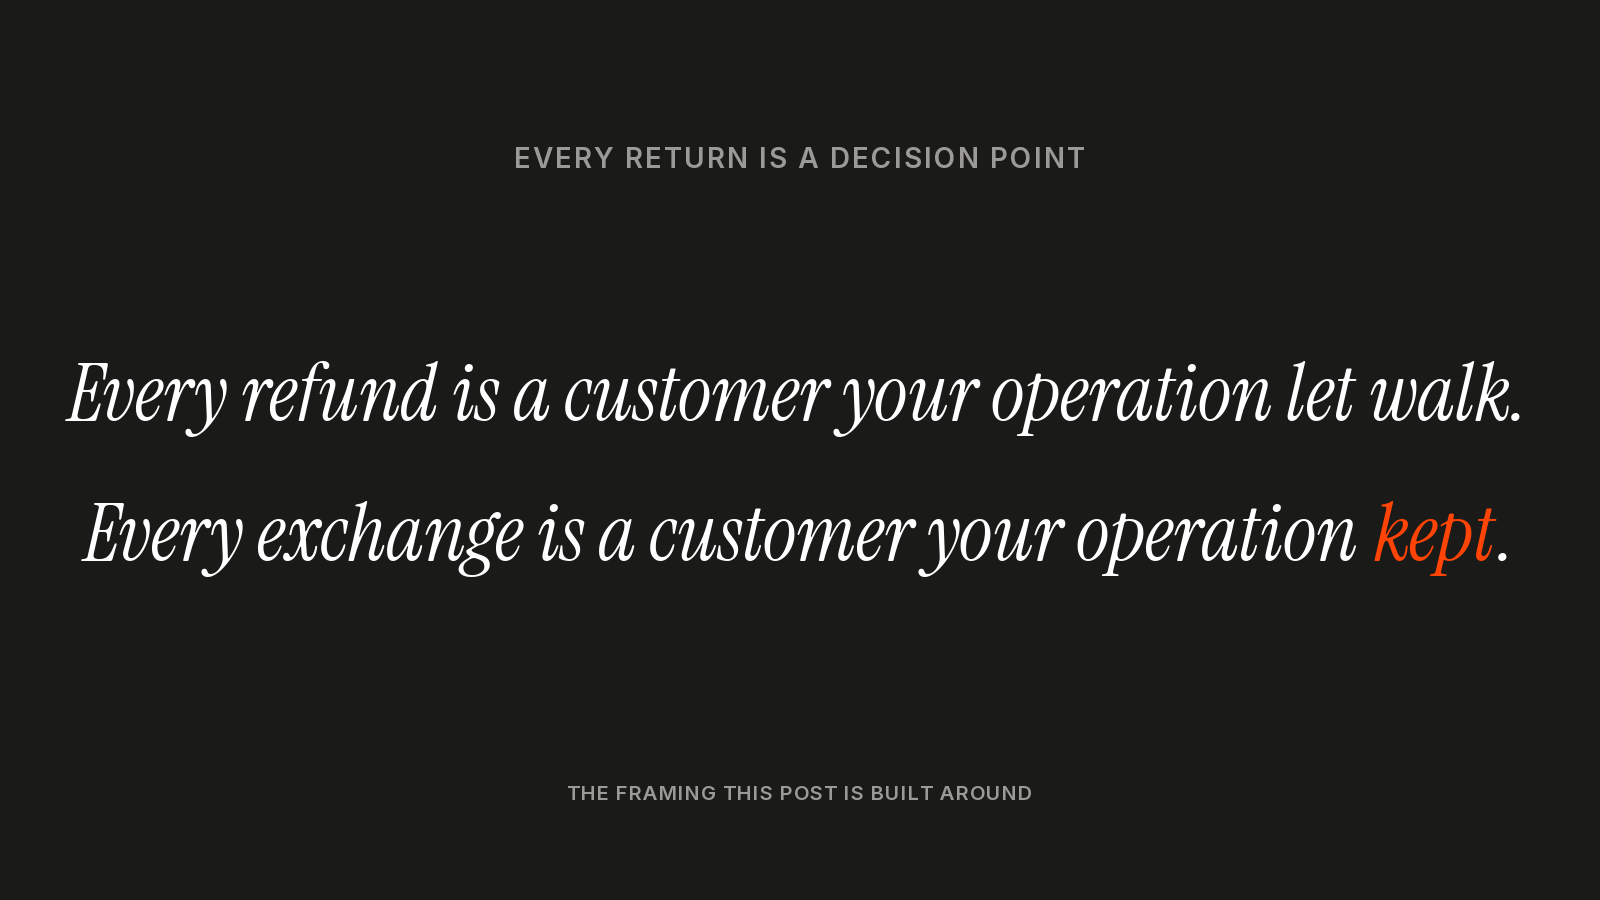
The reason this number matters more than most operators recognize is that every return is a decision point. The customer has already decided to leave the transaction; the only question is whether they leave the relationship too. An exchange keeps them in. A refund lets them out. Treating exchange rate as a customer service metric (how quickly do we process the request?) is missing what the number actually represents: the percentage of departing customers your operation manages to retain.
That is a retention metric. It belongs next to repeat purchase rate, LTV, and churn, not buried in the returns operations report that gets reviewed once a quarter.
Why Most Brands Do Not Measure It
The reasons exchange rate gets ignored are predictable and structural.
Most returns platforms were built around process metrics: average days to refund, return shipping cost per order, percentage of returns inspected within SLA. These are the right questions to ask if returns are a cost center. They are the wrong questions to ask if returns are a retention surface. The platforms that surface exchange rate as a top-level metric are still a minority of the market, which means most operators never see the number unless they go looking for it.
The data also lives in awkward places. The returns platform knows which returns became exchanges. The ecommerce platform knows the original order details. The accounting system reconciles the financial flow. Stitching those together to compute a clean exchange rate by SKU, by category, or by customer segment is more work than most teams have prioritized. So the number stays hidden behind a manual stitch that nobody bothers to build.
And finally, the org structure rarely puts exchange rate in front of someone with the authority to act on it. Returns operations reports to logistics or customer service. Retention metrics report to growth or marketing. Exchange rate sits in the gap, owned by everyone and operated by nobody.
The Compounding Effect on Other Retention Metrics
The reason exchange rate deserves the upgrade from ops KPI to retention metric is that it compounds directly into the metrics every operator already cares about.
Lifetime value. A customer who exchanges spends more over the next 12 months than a customer who took a refund. The exchange itself is a transaction the brand retained. The customer is also meaningfully more likely to make another purchase in the following 30 to 90 days, because the exchange experience reinforced the relationship rather than ending it. A customer who walked away with a refund, by contrast, is statistically more likely to never come back.
Repeat purchase rate. Every exchange is a repeat purchase by definition: the customer selected another product from your catalog rather than walking away. Brands with a 40 percent exchange rate are generating a meaningful share of their repeat purchase volume from the returns funnel alone. Brands with a 10 percent exchange rate are missing that contribution entirely.
Churn. A refund is often a quiet churn event. The customer leaves the ecosystem without ever telling you they were unhappy with the product, the size, the experience. By the time the churn dashboard registers their absence three to six months later, the recovery window has closed. Exchange rate is the leading indicator that surfaces this attrition while it is still actionable.
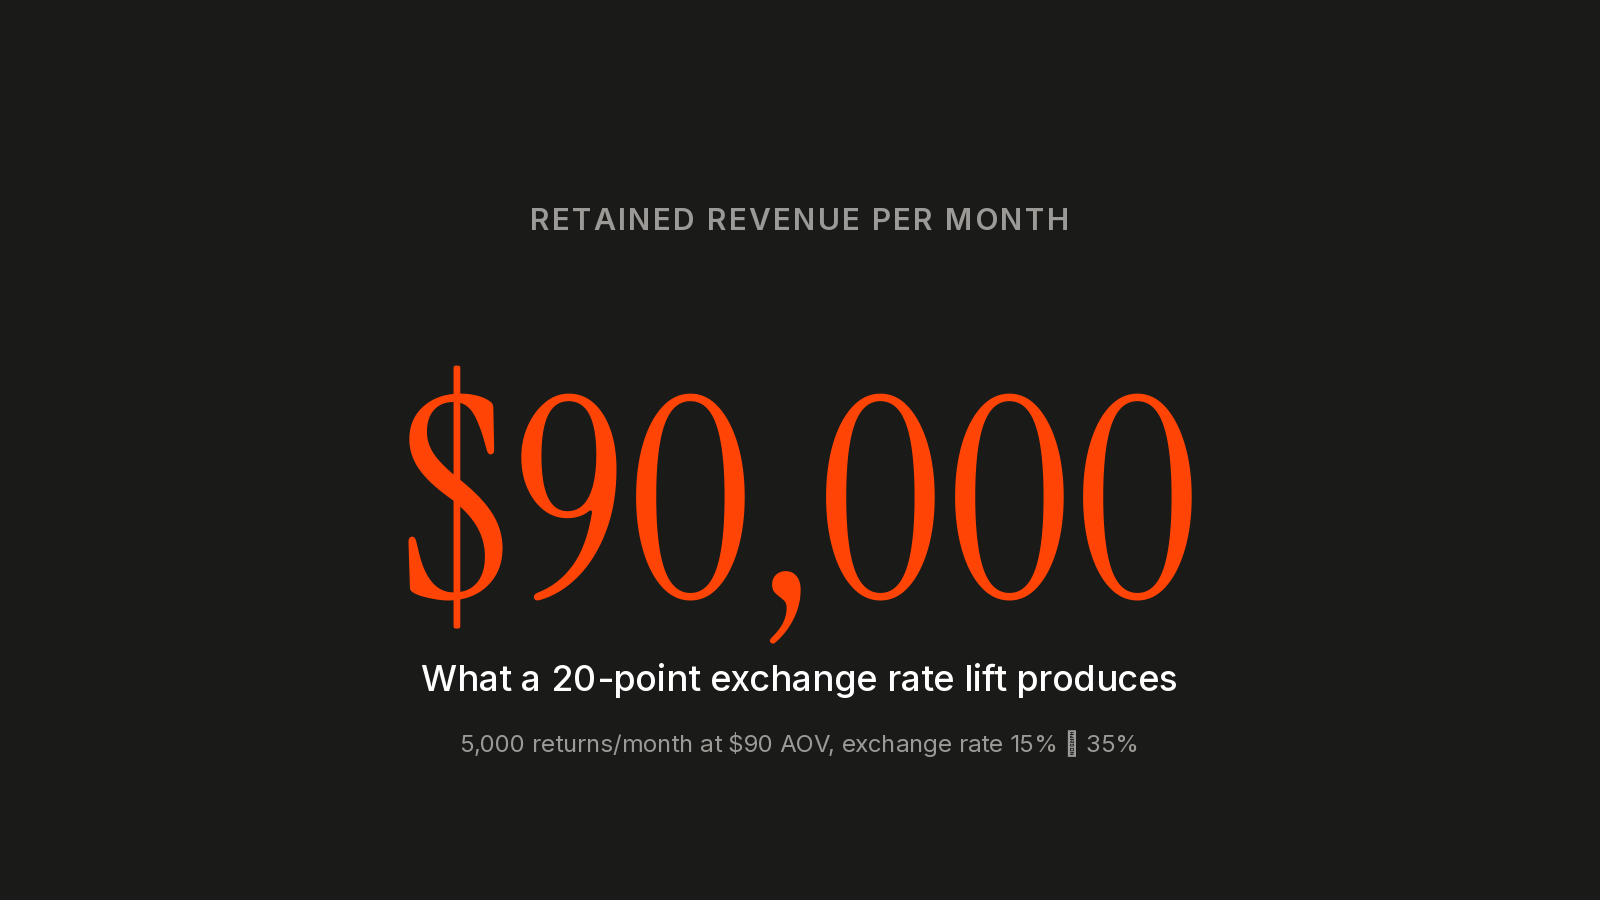
The aggregate effect is non-linear. A 20-point exchange rate improvement (from 15 percent to 35 percent) on a brand processing 5,000 returns per month at a $90 average order value produces roughly $90,000 in retained revenue per month, plus the compounding effect on the lifetime value of every retained customer. Over 12 months, the cumulative impact dwarfs most conversion-rate optimization programs.
The Margin Math
The per-transaction comparison is straightforward but rarely run.
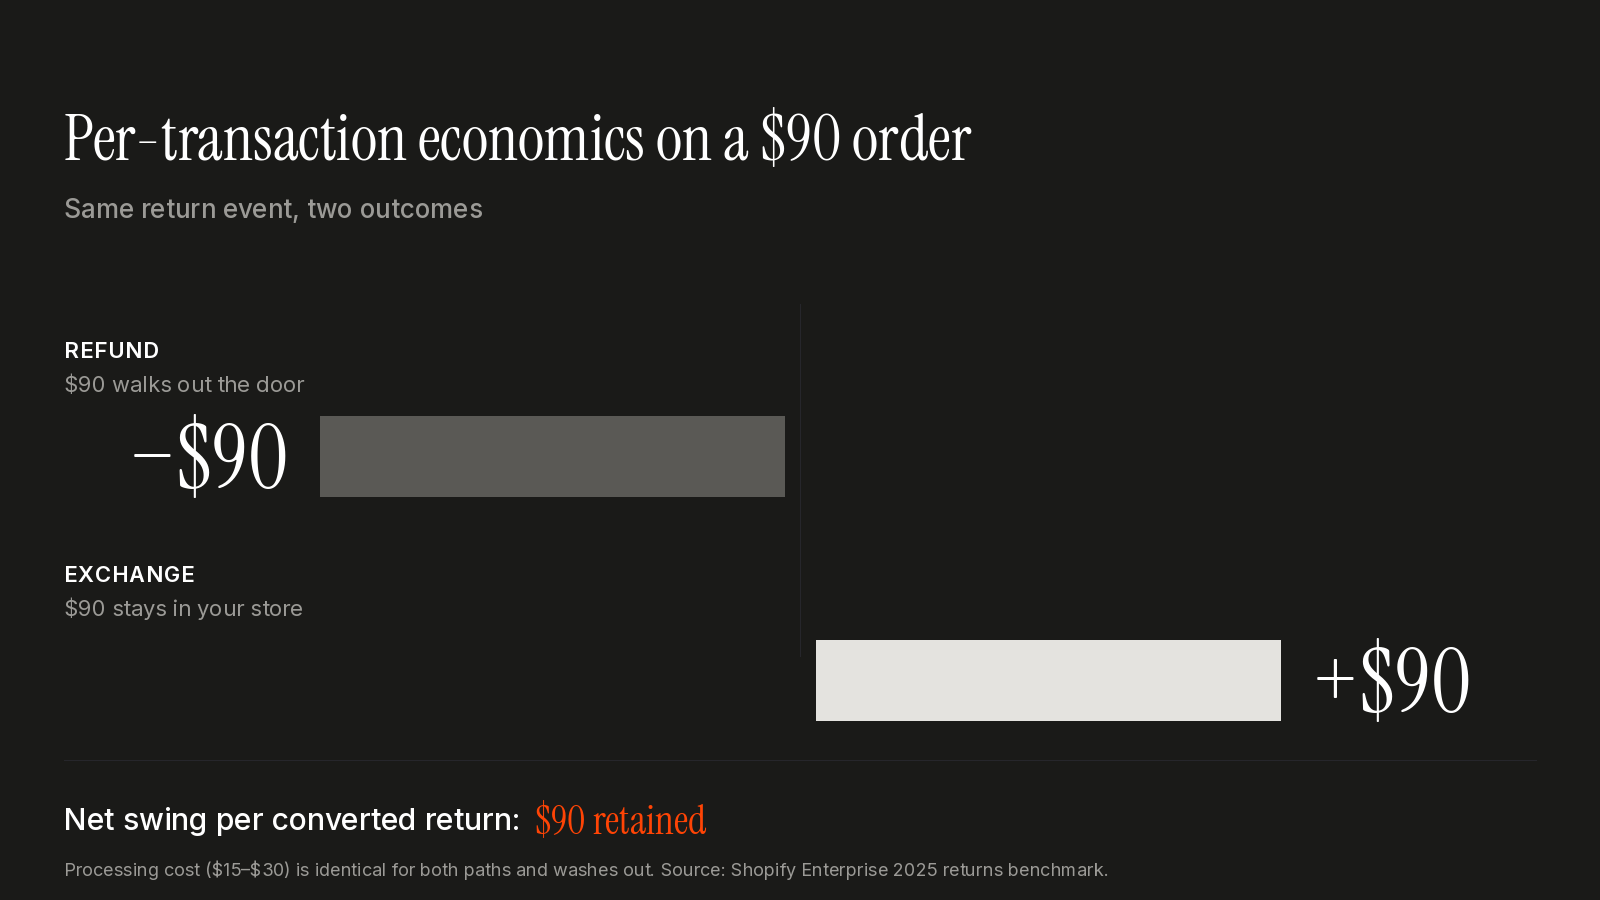
A refund costs the brand the original product revenue plus reverse logistics (shipping label, processing labor, inventory write-down for items that cannot be restocked at full price). According to Shopify Enterprise's 2025 returns benchmark, the all-in cost of processing a single return runs $15 to $30 once labor, shipping, and inventory adjustments are factored. The product revenue is then lost entirely on top of the processing cost.
An exchange costs the brand the same reverse logistics. The item still has to come back. But the product revenue is retained because the customer applied it toward a different product. The net economic impact is the cost of processing minus the revenue retained, which often runs net-positive once you factor in the new product's margin contribution.
Multiplied across a year of returns, the difference between a 15 percent exchange rate and a 35 percent exchange rate at moderate scale is hundreds of thousands of dollars in retained margin. That is the same scale of impact you would expect from a serious paid acquisition or CRO investment, captured by improving the operational design of the returns funnel rather than buying more traffic.
What Actually Moves Exchange Rate
The levers that move exchange rate are operational, not aspirational.
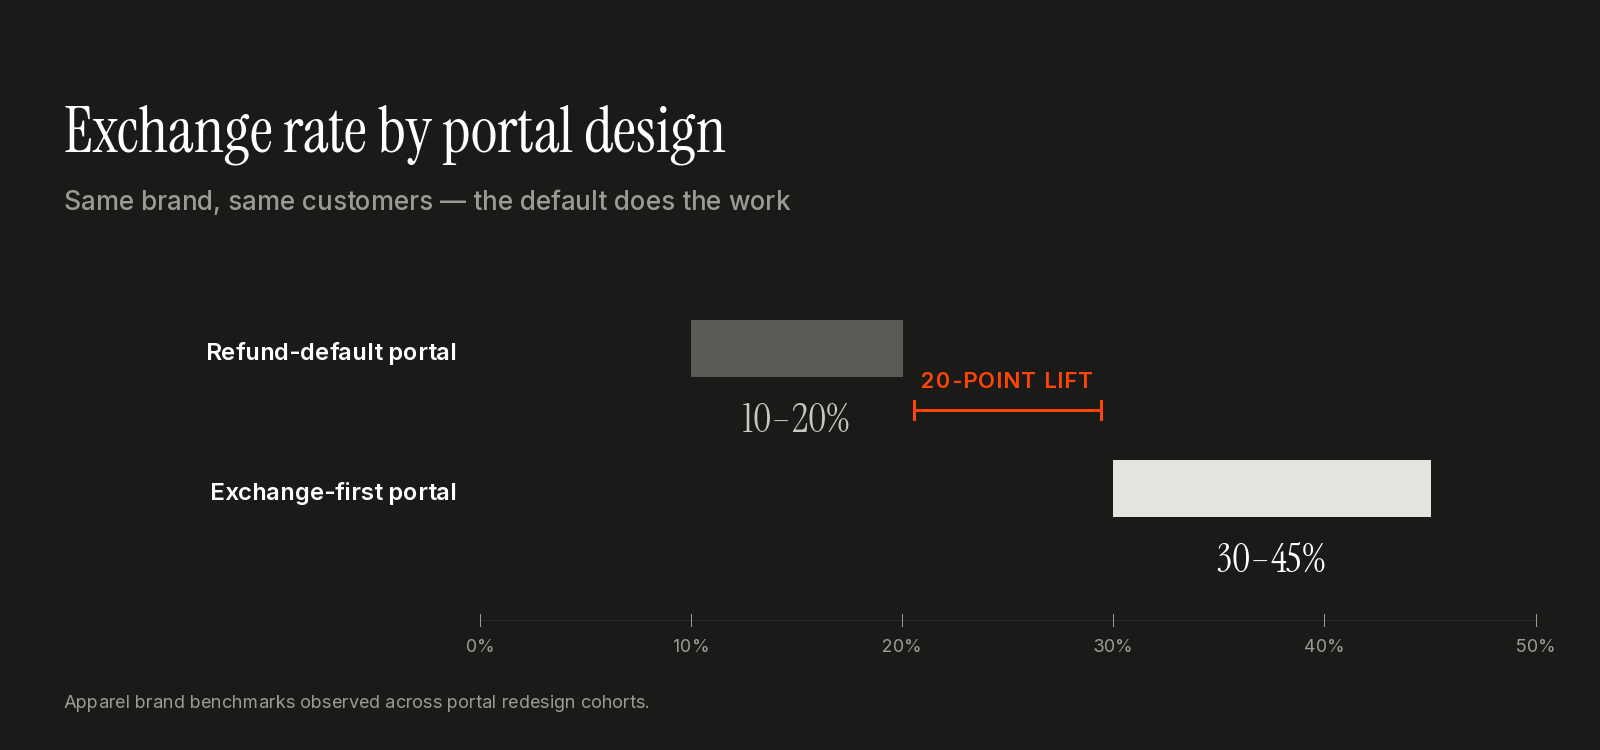
Portal design. A returns portal that presents "refund" as the default action and exchange as a secondary option produces low exchange rates. A portal that presents exchange options first, with refund as the secondary path, produces higher exchange rates. The default is the dominant variable. Most legacy portals default to refund because that was the lowest-friction outcome for the operations team; the cost of that default is invisible until you measure exchange rate.
Exchange recommendations. Showing a customer the entire catalog when they want to exchange a size-medium navy sweater produces abandonment. Showing them three relevant alternatives in their size and color preference produces exchanges. AI-driven recommendation logic on the returns portal is one of the highest-impact interventions available, and the gap between platforms that have it and platforms that do not is large.
Exchange incentives with guardrails. A bonus store credit applied to exchanges (often $5 to $15 depending on AOV) consistently lifts exchange rates. The trap is unprotected bonuses that leak as standalone store credit when customers do not complete the exchange. Properly designed incentives only pay out when the exchange is actually completed.
Inventory visibility. Customers cannot exchange for items that are out of stock. Real-time inventory visibility on the exchange portal, including the option to request notification when an out-of-stock item returns, captures customers who would otherwise default to the refund.
This is what Redo's returns platform was built around. AI-powered recommendations, protected exchange bonuses, and unified inventory visibility ship together as the operational layer that moves exchange rate from a baseline metric to a leading retention indicator. The deeper playbook on engineering this lift, including specific bonus levels and portal design patterns, is in our cornerstone guide on increasing exchange rate.
How to Start Measuring It This Week
The simplest definition works for most operators:
Exchange rate equals exchanges in period divided by total returns in period, expressed as a percentage.
The data should come from your returns platform if it surfaces the metric directly, or from a manual export of return resolution status if it does not. The minimum useful refresh cadence is weekly; daily is better once the metric is integrated into the team's operating rhythm.
The segments worth tracking from day one are exchange rate by product category, by customer segment (new versus returning), and by return reason. These segments surface where the operational leverage lives. A 60 percent exchange rate on tops and a 10 percent exchange rate on bottoms tells you something specific is happening in the bottoms portal experience that is not happening for tops; the segment cut is what makes the diagnosis possible.
Redo's returns analytics surface exchange rate at the SKU, category, and customer-segment levels with the segments pre-built and the refresh cadence automated, which is the configuration most operators want without having to construct it themselves.
The deeper move on the operational side is in our cornerstone on turning returns into exchanges, which covers the portal-design changes that move the metric most reliably.
What Best-in-Class Looks Like
Across the brands operating well on exchange rate, the patterns are consistent.
Aggregate exchange rate sits between 30 and 45 percent for apparel brands that have built the portal experience around exchange-first design. Brands at the lower end of the category (10 to 20 percent) typically have refund-first portals and no exchange incentive program. The 20-point gap is what the operational interventions deliver.
The brands at the top of the category typically have a few attributes in common. Exchange rate is on the weekly retention dashboard, not buried in the returns ops report. The portal defaults are tested and updated regularly. Exchange bonuses run with guardrails. The team treats every refund as a learning opportunity, asking what would have made this customer choose exchange instead.
The brands that hit those marks compound the effect over 12 to 24 months. Their LTV cohort curves bend upward because retained customers spend more. Their repeat purchase rate stays high because exchanges directly contribute. Their NPS and Trustpilot scores improve because the post-purchase experience is engineered for retention rather than fast refund processing.
The Strategic Implication
Exchange rate is the metric that connects returns operations to retention strategy. Brands that measure it cleanly and act on it own a lever most of their competitors have not even identified. The lever runs from the design of the returns portal through the customer experience and into the cohort curves that determine the business's long-term health.
The simplest move is the most valuable one: put exchange rate on the same dashboard as repeat purchase rate, LTV, and churn. Watch it weekly. Treat it as a retention metric that responds to operational design, not as an ops KPI that no one owns. Brands that make that single org-design change consistently outperform peers who keep treating returns as a cost center.
Ready to see what your exchange rate looks like under a proper analytics lens? Book a demo and we will walk through how Redo surfaces exchange rate by category, customer segment, and SKU, and how the platform's returns funnel design moves the metric upward over the first 90 days.
Key Insight
Exchange rate is the highest-leverage retention metric most operators do not measure. Every refund is a customer your operation let walk; every exchange is a customer your operation kept. The metric compounds directly into LTV, repeat purchase rate, and churn, and unlike those downstream metrics, exchange rate responds to operational design changes you can ship in days, not quarters. The brands that move first build a retention engine that compounds for years; the brands that wait keep measuring downstream metrics whose ceiling is set by the operational design choices they have not yet examined.
About Redo
Redo helps ecommerce brands turn post-purchase moments into lasting relationships.
Use AI-powered return flows, exchange-first logic, instant credit, and analytics to understand not just what customers bought, but why they come back.